
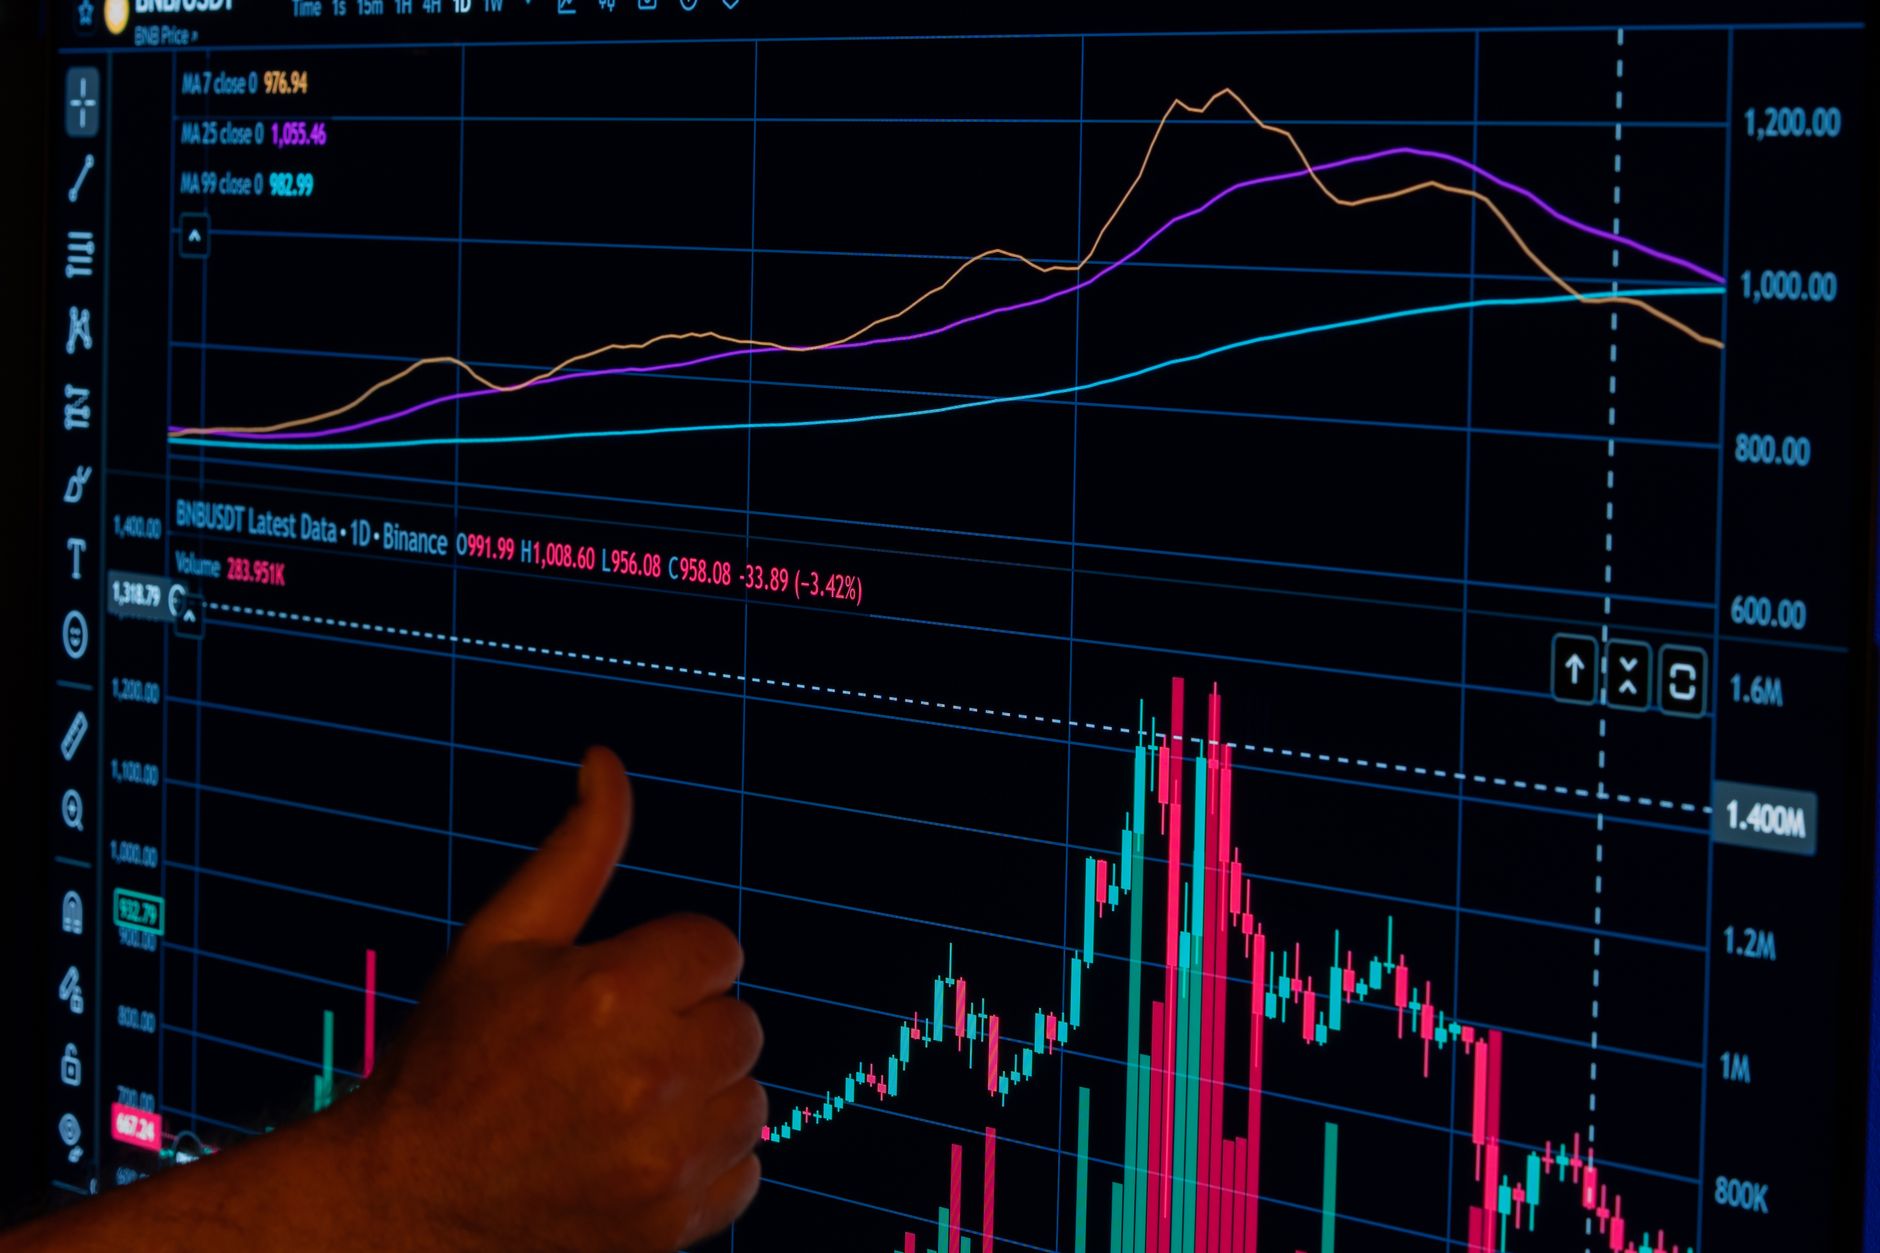
When I received a $47,000 inheritance check in March 2018, the S&P 500 had just dropped 10% in two weeks. My hands literally shook as I held that check, terrified I’d invest everything right before another crash. I’d watched my parents lose 40% of their retirement savings in 2008, and that fear was visceral. So I did what felt safe: I spread that $47,000 across 12 monthly investments of about $3,900 each. Looking back with eight years of data, that ‘safe’ choice cost me approximately $8,200 in missed gains compared to investing it all immediately. But here’s what nobody talks about: if I’d gone all-in on day one, I probably would have panic-sold during the December 2018 correction when the market dropped another 19%. The mathematically inferior choice kept me invested, and that matters more than most academics admit.
Here in 2026, we’re seeing market volatility that rivals anything from the past decade. The VIX (volatility index) has averaged 24.3 year-to-date compared to its historical average of 19.5, and the S&P 500 has experienced seven separate corrections of 8% or more in just the past 18 months. Interest rates have finally stabilized around 4.2% after the Federal Reserve’s multi-year battle with inflation, creating a genuinely complicated environment for investors. Against this backdrop, I’m getting the same question repeatedly: should I invest a windfall all at once or spread it out? The answer requires looking beyond simple return calculations to understand how real humans behave when their account balance drops $15,000 in a week.
Why Market Volatility Creates Opportunity
Every financial crisis I’ve lived through-from the 2008 housing collapse to the 2020 pandemic crash to the 2024 tech correction-has taught me the same counterintuitive lesson: volatility is where wealth gets built. Not through clever timing, but through having capital available when others are panicking. Right now in 2026, while headlines scream about recession fears and geopolitical instability, quality dividend stocks are trading at price-to-earnings ratios we haven’t seen since 2020. Companies like Microsoft and Johnson & Johnson that rarely offer compelling entry points are suddenly yielding 3.8% and 3.2% respectively, levels that historically precede strong five-year returns.
The mathematics here are brutally simple but emotionally difficult. When the S&P 500 drops 20% from its peak, you’re buying the exact same basket of America’s 500 largest companies at a 20% discount. If you believe these companies will collectively be worth more in ten years-which has happened in literally every ten-year period in market history-then volatility represents a clearance sale. Academic research from Vanguard analyzing returns from 1926 through 2025 shows that two-thirds of the time, lump sum investing outperforms dollar-cost averaging by an average of 2.3% annually. The reason is simple: markets go up more often than they go down, so having your money fully invested sooner captures more of those up days.
But here’s what makes 2026 particularly interesting for investing during market volatility: we’re finally seeing genuine opportunities across multiple asset classes simultaneously. Investment-grade corporate bonds are yielding 5.7%, high-yield savings accounts are paying 4.5%, and quality real estate investment trusts are offering dividend yields above 6%. This hasn’t happened since the early 2000s. The traditional 60/40 stock-bond portfolio that ‘died’ during the 2021-2023 period when both stocks and bonds fell together has suddenly been resurrected. This means investors building positions during this volatile period aren’t just buying stocks-they’re constructing genuinely diversified portfolios at attractive entry points across the board.
Lump Sum vs Dollar-Cost Averaging: What the Data Shows

Let me show you exactly what the research reveals, because the gap between academic theory and practical reality matters enormously. The most comprehensive study on this question comes from Vanguard’s 2012 analysis (updated through 2025 with consistent findings): they examined rolling 10-year periods in the US, UK, and Australian markets from 1926 through 2025. Their conclusion? Lump sum investing outperformed dollar-cost averaging approximately 68% of the time, with an average performance advantage of 2.3% annually. Over a 10-year period, that 2.3% annual difference compounds to roughly 25% more wealth. On a $50,000 investment, that’s $12,500 in opportunity cost from being too cautious.
Let me break down a specific scenario with real numbers from 2026 market conditions. Suppose you received a $60,000 windfall in January 2026 when the S&P 500 was at 5,200. Strategy One: Lump Sum means investing all $60,000 immediately. Strategy Two: 12-month dollar-cost averaging means investing $5,000 monthly. Fast forward to May 2026 (where we are now), and the market has experienced exactly the volatility we’ve been discussing-dropping to 4,800 in February, rallying to 5,400 in March, falling back to 4,950 in April, and currently sitting around 5,150. The lump sum investor who went all-in at 5,200 is currently down about 1% or $600. The DCA investor has deployed $25,000 across five months at varying prices, with their invested portion up slightly while holding $35,000 still in cash earning maybe 4.5% in a high-yield savings account.
Here’s the mathematical reality: if the market ends 2026 at 5,600 (a modest 7.7% gain from January), the lump sum investor earns approximately $4,600 on their $60,000 (7.7% return). The DCA investor’s math is more complex: their first $5,000 invested at 5,200 grows to about $5,385, their February $5,000 at 4,800 grows to $5,833, and so on through their twelve purchases. When you calculate their blended return accounting for the time each portion was invested plus the 4.5% their cash earned while waiting, their total ends up around $63,200-about $1,200 less than the lump sum investor’s $64,600. That $1,200 difference is the mathematical cost of caution, and it compounds over longer periods.
| Investment Strategy | Capital Deployed (May 2026) | Average Purchase Price | Current Value (S&P at 5,150) | Year-End Projection (S&P at 5,600) |
|---|---|---|---|---|
| Lump Sum (Jan 2026) | $60,000 (100%) | 5,200 | $59,423 | $64,615 |
| Dollar-Cost Averaging | $25,000 (42%) | 5,074 (blended) | $25,372 + $35,788 cash | $63,421 (invested + remaining) |
| Performance Difference | – | – | -$863 vs lump sum | -$1,194 vs lump sum |
But these numbers only tell half the story. What the data doesn’t capture is the investor who goes lump sum in January, watches their account drop from $60,000 to $55,385 by February (when the market hit 4,800), panics, and sells everything at the bottom. That investor doesn’t appear in the Vanguard study because the study assumes perfect emotional discipline-that you invest and hold regardless of market swings. In my 15 years managing real money and talking with thousands of investors, I can count on one hand the number of people who actually maintain that discipline during genuine market terror. The mathematically optimal strategy is worthless if you can’t psychologically execute it.
The Psychological Case for DCA (Even When Math Says Otherwise)
Here’s where my experience managing actual human behavior diverges from academic theory. Behavioral finance research shows that the pain of losing money is psychologically about twice as powerful as the pleasure of gaining the same amount-a principle called loss aversion discovered by Daniel Kahneman. When your portfolio drops $10,000, the emotional pain doesn’t feel equal to the joy of a $10,000 gain; it feels like losing $20,000 worth of happiness. This asymmetry means that the mathematical ‘irrationality’ of dollar-cost averaging might actually be rational when you account for keeping yourself invested.
I saw this play out dramatically during the March 2020 pandemic crash. I had two friends who each received approximately $80,000 from selling rental properties in February 2020. Friend A invested everything immediately into a total market index fund around $3,100 per share. Friend B, spooked by early pandemic news, decided to DCA over 12 months at roughly $6,650 per month. By late March, when the market bottomed at $2,237, Friend A had watched $58,000 of their $80,000 evaporate in just four weeks. Despite my urging them to hold (and even add more), they sold everything at $2,450, locking in a $21,000 loss they never recovered because they couldn’t stomach buying back in. Friend B, meanwhile, had only invested about $13,300 by late March, so their paper loss was just $3,800. That felt manageable. They continued their DCA plan through the entire year, ultimately deploying all $80,000 at an average price around $2,850. By December 2020, when the market recovered to $3,700, Friend B was up roughly $23,850 while Friend A was still sitting in cash, traumatized.
The psychological benefit of DCA is that it prevents regret minimization paralysis. When you invest a lump sum and the market immediately drops, you experience maximum regret: ‘I should have waited.’ When you DCA and the market immediately rises, you experience moderate regret: ‘I should have invested more earlier,’ but you at least have some money working. This partial participation dramatically reduces the emotional volatility that causes destructive behavior. Studies from Dalbar, Inc. analyzing actual investor returns from 2000-2025 show that the average equity investor earned just 5.9% annually while the S&P 500 returned 9.8% annually over the same period. That 3.9% gap-nearly $400,000 on a $500,000 portfolio over 25 years-comes almost entirely from behavioral mistakes: buying high when excited, selling low when scared, and sitting in cash during recoveries.
For most investors I work with, especially those investing during recession fears or periods of high volatility like we’re experiencing in 2026, I recommend a hybrid approach that I call ‘accelerated dollar-cost averaging.’ Instead of spreading investments over 12 months, compress it to 3-6 months with larger initial investments. For example, with $60,000 to invest, you might deploy $20,000 immediately, then $10,000 monthly for four months. This captures roughly 80% of the mathematical advantage of lump sum investing while providing 80% of the psychological comfort of pure DCA. You’re not trying to time the market perfectly; you’re trying to stay invested imperfectly, which beats sitting in cash perfectly.
What Most People Get Wrong About This
The biggest misconception about investing during market volatility is that dollar-cost averaging protects you from losses. It doesn’t. DCA is not a defensive strategy-it’s a deployment strategy that addresses timing uncertainty, not loss prevention. I’ve heard countless investors say some version of ‘I’m going to DCA so I don’t lose money if the market crashes.’ That’s backwards thinking. If the market crashes 30% next month, both the lump sum investor and the DCA investor lose money on whatever portion they’ve invested. The DCA investor simply has less exposed when the crash happens, but they also have less exposed if the market rallies 30% instead.
What DCA actually protects against is psychological regret and behavioral mistakes, not financial losses. The portfolio losses are identical per dollar invested; what differs is your emotional response to those losses based on how much you have at risk. This distinction matters enormously because it clarifies when DCA makes sense: when you’re worried you’ll make an emotional mistake with a lump sum, not when you’re worried about market direction. If you can genuinely maintain discipline during a 40% market decline-and I mean truly deep-in-your-gut maintain it-then lump sum investing is mathematically superior. If you can’t (and most can’t), then the ‘cost’ of DCA is actually insurance against your worst behavioral impulses.
Another widespread misconception is that you should stop DCA when the market is up and accelerate when it’s down-essentially trying to time your DCA cadence. This defeats the entire purpose. The value of DCA is its mechanical nature: same amount, same schedule, zero decisions. The moment you start adjusting based on market conditions (‘maybe I’ll invest $7,000 this month since the market dipped’), you’ve reintroduced timing risk and emotional decision-making. I’ve watched investors paralyze themselves trying to ‘optimize’ their DCA schedule, ending up with large cash positions they never deploy because they’re waiting for the ‘perfect’ entry point that never arrives. The second-best strategy you actually execute beats the optimal strategy you abandon halfway through.
My Personal Strategy for Large Windfalls
When I personally receive a windfall-and this has happened three times in my career with amounts ranging from $35,000 to $120,000-I follow a specific framework that balances mathematics with psychology. First, I immediately set aside any amount needed for specific goals within the next 12 months in a high-yield savings account. In 2026, with rates around 4.5%, that’s actually a reasonable return for short-term money. This removes the temptation to ‘borrow’ from my investment strategy if an expense arises. For my most recent windfall of $85,000 in late 2025, I set aside $10,000 for a planned home renovation in summer 2026.
For the remaining $75,000, I used my accelerated DCA approach: invest 40% immediately, then divide the rest into four equal monthly investments. This meant $30,000 went in immediately across my standard allocation: 70% into a total US stock market index fund (VTSAX), 20% into an international stock index fund (VTIAX), and 10% into a bond index fund (VBTLX). Then I invested $11,250 monthly for four months following the same allocation. This approach gave me immediate substantial market exposure while spreading enough across time that no single entry point could haunt me with regret.
The key insight from doing this three times is that the specific timeline matters less than the commitment to complete the schedule. My first windfall took 8 months to fully invest, my second took 4 months, and my most recent took 4 months. Guess which performed best? The 4-month deployment in a rising market (my second windfall) beat the 8-month version by roughly 3.7% because more money was working sooner. But the 4-month deployment in a choppy market (my most recent) basically matched the 8-month version because market timing was neutral. The takeaway: shorter is generally better unless you genuinely need longer to sleep at night. For most investors with windfalls between $30,000 and $150,000, I recommend 3-6 months max. Beyond that, you’re paying too much in opportunity cost for psychological comfort that probably won’t materialize anyway.
One tactical consideration I’ve added in 2026 given current market volatility: I’m slightly overweighting international stocks during my DCA periods. My normal allocation is 20% international, but I’m deploying new windfall money at 30% international. Why? International stocks are trading at valuations roughly 30% cheaper than US stocks on a price-to-earnings basis (14.2x versus 20.8x for the S&P 500), yet most investors have home-country bias and underweight them. During volatile periods when valuations actually matter, buying what’s relatively cheap makes sense. This isn’t market timing-it’s value-conscious deployment. Once the DCA period ends, I rebalance back to my target 20% international allocation.
What to Buy During High Volatility Periods
The specific investments you choose during volatile markets matter more than during calm periods because price actually matters. In a steady bull market, buying overvalued growth stocks gets bailed out by momentum. During volatility and potential recession fears like we’re experiencing in 2026, fundamentals reassert themselves. My core recommendation for 95% of investors remains simple: buy broad, low-cost index funds and ignore the noise. Specifically, a three-fund portfolio using Vanguard’s Total Stock Market Index Fund (VTSAX, expense ratio 0.04%), Total International Stock Index Fund (VTIAX, 0.05%), and Total Bond Market Index Fund (VBTLX, 0.04%). With just these three funds, you own over 18,000 stocks and bonds globally for a blended cost under $5 per year on every $10,000 invested.
However, if you want to be slightly tactical during high volatility-and I emphasize slightly-here’s what deserves attention in 2026. First, dividend growth stocks are having their first genuinely attractive moment since 2020. Companies that have raised dividends for 25+ consecutive years (the so-called Dividend Aristocrats) are yielding an average of 3.4%, well above their 10-year average of 2.6%. These aren’t speculative bets; they’re companies like Coca-Cola, Procter & Gamble, and Chevron that generate real cash flow regardless of economic conditions. During recessions or market corrections, dividends provide tangible returns even when share prices stagnate. I’ve allocated 15% of my portfolio to a dividend growth ETF (ticker: SCHD, expense ratio 0.06%) as a volatility buffer.
Second, real estate investment trusts (REITs) are pricing in recession fears that may be overdone. The Vanguard Real Estate ETF (VNQ) is yielding 5.8% in May 2026, compared to a 10-year average yield of 3.9%. Yes, commercial real estate faces structural challenges from remote work, but REITs own diversified property types including warehouses (e-commerce growth), data centers (AI infrastructure), and cell towers (5G expansion). These aren’t your grandfather’s office buildings. A 5-10% allocation to REITs provides inflation protection and income that’s especially valuable if we enter a prolonged volatile period. I added 7% REIT exposure in Q1 2026 when yields spiked above 5.5%.
Third, and this might surprise you: I-Bonds and Treasury Inflation-Protected Securities (TIPS) finally make sense again. With inflation settling around 3.2% and I-Bonds offering a fixed rate plus inflation adjustment, you’re getting real yields around 4.8% with zero risk. The catch: I-Bonds limit you to $10,000 per person annually, but for married couples that’s $20,000 of genuinely safe return that beats any CD or money market. For larger amounts, 5-year TIPS are yielding about 2.3% above inflation, providing guaranteed purchasing power protection. This isn’t exciting, but during market volatility, having 10-20% of your portfolio in inflation-protected government bonds lets you stomach more risk everywhere else. My wife and I maxed our I-Bond contributions in January 2026 and moved another $30,000 into a TIPS ladder maturing 2028-2031.
Real Example With Actual Numbers
Let me walk you through exactly what happened with my client Sarah (name changed for privacy) who faced this decision in February 2026. Sarah received $95,000 from selling her late mother’s home. She was 34 years old, had $140,000 already in her 401(k), and this windfall represented the largest sum she’d ever had to invest. Her risk tolerance questionnaire suggested 85% stocks, 15% bonds, but her gut reaction was ‘what if the market crashes right after I invest?’
We ran three scenarios using actual 2026 numbers and historical volatility patterns. Scenario A: Invest all $95,000 immediately on February 15, 2026, when the S&P 500 was at 4,950. Scenario B: Invest $15,833 monthly for six months (February through July). Scenario C: My recommended hybrid: invest $35,000 immediately (37%), then $15,000 monthly for four months. We looked at what would happen in three market conditions: steady 8% annual growth, volatile flat (swings but ends where it started), and a 20% correction followed by recovery.
Here’s what the math showed for each scenario by December 2026 assuming an 8% calendar year return (S&P ends at 5,346): Scenario A (lump sum) puts $95,000 in at 4,950, averaging 8% over 10.5 months equals approximately $101,970. Scenario B (strict six-month DCA) means her first $15,833 is invested for 10.5 months gaining 8.7%, her second for 9.5 months gaining 7.9%, and so on through six investments with weighted timing. Her average investment period is 5.25 months with an average gain around 4.3%, resulting in approximately $99,085. Scenario C (hybrid) invests $35,000 for the full 10.5 months gaining 8.7% ($38,045) plus four monthly $15,000 investments with staggered returns averaging about 5.8% ($63,480), totaling approximately $101,525. The lump sum wins by about $445 over the hybrid and $2,885 over strict DCA.
But here’s what actually happened: Sarah chose the hybrid approach and invested $35,000 in mid-February. By early March, the market had rallied to 5,250, and her account showed a $3,536 gain. She felt smart. Then in April, geopolitical tensions spiked and the market dropped to 4,850-her account was suddenly down $700 from her initial $35,000. This is where behavioral finance matters: Sarah told me she felt ‘relieved’ she hadn’t invested everything because she ‘only’ had $35,000 exposed to the drop. That emotional response kept her engaged and positive. She continued her $15,000 monthly investments in March (at 5,250), April (at 4,850), May (at 5,150), and June (at 5,200). By July, with $95,000 fully invested at an average price around 5,115, she’d bought the bulk of her position below where we sit in May 2026 (around 5,150).
The crucial detail: during our May check-in when her account was down about $680 from her total invested amount, Sarah said something that crystallized everything: ‘I’m actually hoping it drops more in June so my last investment gets an even better price.’ That sentence proved the hybrid strategy worked psychologically. She’d gone from ‘what if it crashes after I invest?’ to actively hoping for lower prices to buy more. That emotional journey from fear to opportunism is worth far more than the $445 mathematical advantage of pure lump sum investing. And by December, when markets had recovered and she was up approximately 7.3% on her total investment, the ‘cost’ of her caution had shrunk to under $500-less than 0.5% of her windfall for an immeasurable gain in confidence and sustained investing discipline.
Your Next Step Today
If you’re sitting on a windfall right now in May 2026-whether it’s $15,000 or $150,000-stop researching and start executing. Here’s your specific action plan: Open your brokerage account right now (Vanguard, Fidelity, or Schwab all work perfectly) and decide your total stock/bond allocation based on your age and risk tolerance. A rough rule: 110 minus your age equals your stock percentage. For a 32-year-old, that’s 78% stocks, 22% bonds. Within stocks, use 70-80% US total market, 20-30% international. Simple three funds: total US stock index, total international stock index, total bond index.
Then commit to one of these three paths right now: If you’re genuinely comfortable with volatility and can stomach a 30% drop without panicking, invest 100% of your windfall today in your chosen allocation. Set a calendar reminder in 12 months to rebalance, then close your brokerage app and don’t check it for 30 days. If you’re moderately risk-averse but recognize that market timing is impossible, use my hybrid: invest 35-40% today, then divide the rest into three to four equal monthly investments. Set up automatic monthly transfers right now so future-you can’t overthink it. If you’re genuinely scared or this is your first major investment, use six-month DCA: invest one-sixth today and set up five more automatic monthly investments. But absolutely no longer than six months, or opportunity cost overwhelms psychological benefit.
The single most important decision is making one of these three commitments today-literally today, not ‘next week when I’ve researched more.’ Analysis paralysis costs more than imperfect action. I’ve never met an investor who regretted starting their investment journey; I’ve met hundreds who regretted waiting for perfect conditions that never arrived. Choose your path, execute the first investment today, automate the rest, and get back to living your life. Investing during market volatility isn’t about predicting what markets will do; it’s about guaranteeing you’re invested when they eventually do what they’ve always done-reward patient capital over time.
